The Filehne experiment
Motivations
Speed perception has been intensively studied in vision. Even if the behaviour of speed mechanisms is still on debate ([Fre01][FCW10]), it exists low motion mechanisms that can extract the speed information.
Todo
mention the difference between speed and velocity. Meaning velocity contains speed and direction.
In audition, speed seems to be a difficult cue to extract and several findings suggested that audition doesn’t have low level mechanisms but can still extract the information [Gra86][MG91]. We want to understand how speed perception is affected in audition when head movements occur and compare the results with vision findings. A famous illusion named after his author [Fil22] showed how speed perception is affected in vision when eyes movements occur.
During eye movements, the world around us remains perceptually stable despite of the retinal image slip (see Fig. 5). The pursuit adds motion to the image, hence, the brain must add this new estimate to the image motion in order to recover the object motion. This process doesn’t work accuratly resulting in misperception of the object velocity during pursuit. This has been shown through several illusions such as the Aubert-Fleishl phenomenon ([Aub86]) where the pursued stimulus appears slower or the Filehne illusion ([Fil22]) showing that stationary objects appear to move. We will discuss the latter below and its impact on audition.
This illusion was named after the research who found it ([Fil22]). The illusion showed that a stationary object appears to move against the eyes movement. This process imply two estimates:
Fig. 6 Motion perception with or without eye pursuit of a moving object. The first image shows the perceived motion during eye fixation. The second shows the percieved motion during an eye pursuit.
- the retinal image motion,
- the occulomotor system feedback known as ERS.
When we make a smooth eye movement to track a moving object, the visual system estimates the eyes velocity (using the ERS) and then substract it from the observed retinal motion Fig. 7.

Fig. 7 Signals used to infer the motion of an object during an eye pursuit.
As shown on the retinal image motion and the eye muscles feedback goes in opposite direction during the smooth pursuit. In order to obtain the object as stationary, these two estimates as to be equal.

Fig. 8 Filehne illusion. Estimation of the speed of an object \(\widehat{H}\) through the estimates of the eye pursuit \(\widehat{P}\) and the retinal image motion \(\widehat{R}\).
| vision | Audition |
|---|---|
| Eyes rotation | Head rotation |
| Dot | Noise |
| Grating background | No background |
| No visual reference | No auditory and visual reference |
Todo
Find a way to insert a caption for this table. The caption should be the following: Equivalences between visual and auditory Filehne experiement.
Todo
Equivalence have no reference in the text at the moment, need to be fixed
Broadcasting and motion of the acoustic signals
In order to create a smooth motion we decided to have one signal per speaker and apply a spatial gaussian window letting us to compute the gains to apply on each channel for a given source position. In order to avoid phase problems at the listener’s head, we used on each channel independent random gaussian noises. The spatial window is computed with a gaussian function (shown on (1)).
The gain for each channel is given by \(x\) the position in degrees of each speaker, \(p\) the position of the source and \(w\) the width (spread or standard deviation) of the source in degrees. If \(w = 0\), the source will be very ponctual [1], if \(w > 0\), will be broadcast on several speakers. The position of the source is discrete with a \(0.1^\circ\) step. This is enough to obtain a perceived smooth and homogeneous movement and is much lower than the best MAA of \(1^\circ\) in front of the listener ([Mil58]) and consequently of the MAMA that is around \(1^\circ\) or larger ([SP90][CG92][SMP92]). One limitation of this technique is related to the physical distance between the speakers and corresponds to the parameter \(w\) of the equation (1). The parameter \(w\) can’t be lower than the minimum distance between two loudspeakers. In this particular case, the motion will not be smooth anymore but will jump from one speaker to another. Another limitation is the computer’s processor. Because the experiment has a real time constraint (due to the acquisition of head position data), the filtering process can disrupt the real processing.

Fig. 9 Spatialisation of the stimuli using an array of loudspeakers. Intensity of each speaker is respect to the gain of a gaussian function. These gains change over time.
Head motion, the pursuit
A key point of the experiment is to control the participant head movement in order to keep his head speed as constant as possible. In vision, we know that eye movements are saccadic they can move smoothly when pursuit. First we tested on ourselves our capaticy to move our head at constant speed. It appeared that it was a very difficult task. It has been decided to lead a small and informal experiment in order to find the best method to obtain smooth head movements. We measured 6 participants using a metronome. The metronome used a click stimulus.
Todo
Nature and description of the conditions.
Participants were asked to anticipate the stimulus by pointing their nose at the click locations. A trial corresponded to two back and forth of the head The results showed mainly saccadic behaviors not related to the speed condition and not constant over time.
Todo
number of trial per session.
We decided then to use a pursuit noise that participants have to follow by pointing their nose at it. In order to help them to differenciate the test itself from the pursuit, a low-pass filter were applied on the pursuit.
Auditory Filehne experiment
Paradigm
The aim of the experiment was to examined the auditory motion perception during head movements. The general task took the form of a 2AFC in which the subject was required to indicate which direction the stimulus appeared to move. Each trial was decomposed in two parts:
- the pursuit,
- the test.
Each subject participated to 4 sessions containing each three blocks. Before the first session [2], a training was carried out to familiarise participants with the task. Each session corresponded to three head speed conditions: \(20\), \(40\) and \(60~^\circ/s\). One block contained 140 trials and lasted about 30 minutes. Hence, one participant performed 1680 trials over 6 hours of experiment. Participant were free to choose how many blocks they want to do each time. If they chose to do at least two blocks, a rest of 5 mins were given between each block.
Todo
Why we decided to use this type of pursuit and another one ? Because the equivalent of a moving dot is a moving sound but with the problem of a non finite width, we choose to use a low pass filter to limit the interferences with the test and the we were obliged to stop the pursuit in order to not interfere with the test. In vision, usually use judge the background and not the the dot.
The pursuit in each condition lasted 3 seconds. The information about the pursuit are shown on Table 2 and Fig. 11. In order to balance the experiment, the pursuit direction was alternated on each trial.
The participant had to follow the pursuit by pointing is nose at it. This lasted two sweeps (back and forth), then the subject had to make a third sweep by himself. During this time, the test was presented and the participant had to judge his direction. The test was presented in order that both the test and the participants head should cross the \(0^\circ\) at the same time (Fig. 10).

Fig. 10 Process of the experiment over time and angular position of the head. The black plain line represents the head movement when the pursuit stimulus is on. The Black dashed line, the head movement when the pursuit is off. The blue thick line represents the test presentation.
| Condition (\(^\circ/s\)) | Duration (\(s\)) | Displacement range (\(^\circ\)) | Total displacement (\(^\circ\)) |
|---|---|---|---|
| \(20\) | \(3\) | \(\pm15\) | \(60\) |
| \(40\) | \(3\) | \(\pm30$\) | \(120\) |
| \(60\) | \(3\) | \(\pm60\) | \(180\) |
Todo
caption to put with the table Head pursuit information regarding each condition such as total duration, displacement range (one head sweep) and total displacement.
The test was randomised on each trial using a range of duration from \(400\) to \(600~ms\). A range of 5 speeds with a step of \(8^\circ/s\). The basic range was from \(-24\) to \(24~^\circ/s\). After a preliminary analysis of the training, it was decided to shift the range of speeds in order to get a PSE. In order to prevent participants to make judgements according to the start and end of the stimulus ([CB02]), the test has been roved and its center varied between \(\pm7.5~^\circ\) (as shown on Fig. 11).

Fig. 11 Description of the experiment in terms of source and head displacement. The head movement according to the conditions will have maximum displacement of \(90^\circ\) centred on \(0^\circ\) (@ \(60^\circ/s\)). The source will displacement is changing randomly from trial to trial and it’s centre is always between \(\pm~7.5^\circ\)
Todo
- Talk about the intensity experiment that did not work until now
- change the different inkscape figure by their tikz equivalent
- save in a different folder, all script generating tikz plot from octave in a specific folder
Analysis
On the six subjects, everyone completed the task required. Nevertheless, the analysis revealed that two of these participants had a strange behaviour and showed the biggest effect regarding the other participants. Outliers were defined as no head motion during the test stimulus presentation and as data acquisition problem. Per session, on average, there is about \(0.13\%\) of outliers with a maximum of 3 outliers on a session and a minimum of 0. This low percentage of trial rejection is explained by the observation of head movements on average and decided to keep almost all trials to lead an analysis based on true head movements. Results have been computer on each session and then averaged to get PSEs.
Head movements
Head movements were driven by an audio pursuit target, but like eye movements to a lesser extent, they tends to be saccadic even when pursuit. To reduce this effect, a Savitzky-Golay filter ([SG64]) was applied on each trial. This process is achieved by using a local least-squares polynomial approximation (approximation of the second order in our case) resulting to a low pass filter on the data set [3].
Fig. 12 shows a typical head movement on a trial. The ideal head movement describes a triangle signal in order to keep a constant speed over time and angular displacement. Nevertheless, participants showed difficulties to reproduce correctly this pattern. This is explained by several reasons. Firstly, a typical participant pattern is a sinusoidal signal. The change of head direction can’t be immediate due to the weight and inertia of the head. This effect add a delay to the pursuit. The other problem is poor width definition of an audio source. This prevents a good pursuit of the source. Because participant were in the dark with no visual cue, they can’t use speakers or other references to stop or anticipate direction changes. This explains why the angular displacement of participant’s head can be lower or greater than the ideal pattern and add another delay. Nevertheless, as shown by the figure Fig. 12, during the phase between head direction changes, the participant is able to keep his head movement quite steady.
Todo
it could be interesting to compute the percentage around the speed target

Fig. 12 Head tracking during a trial at condition \(20~^\circ/s\). orange plain line represents the ideal head movement over time and angular displacement. The blue plain line represents the head movement of participant 1 during the trial 4 of session 1.
In order to extract only smooth pursuit movement during both sweeps of the pursuit task. It has been decided to keep only 1 second of signal when the head is centered on \(0^\circ\) (see Fig. 13). Then, for each condition and participant, the mean speed has been computed on each trial and then averaged across all sessions for the pursuit and test. The results are shown on Fig. 14.

Fig. 13 Head pursuit speed computation. The grey zones represent the meaningful parts of head movements used to compute the head speed during pursuit.
The difficulty of participant to follow the pursuit is confirmed by the left hand side figure that shows the average for each participant and condition during the pursuit presentation. At \(20^\circ/s\) participant are relatively close to the target wheras for \(40\) and \(60^\circ/s\) the general behaviour is to slow down the head speed regarding the target. Nevertheless, participants 4 and 6 tends to keeps their head around the same speed whatever the target is and both are around \(50^\circ/s\). Even if they understood the task, these participant seems to have difficulties to extract the speed information of a moving source and can’t use or make the difference between several sets of interaul cues. If a subject follow perfectly a sound source, the pair of ITD and ILD will not evolve over time [4]. Based on these cues, a subject should be able to tell if he is late or ahead regarding the sound source. These cues are the only cues available during this task and participant 4 and 6 seems to not be able to use in a accurate way these cues.
Todo
These pursuit information are not accurate enough because of the extraction method used. I need to correct that in order two possible ways: either try to find the 0 deg and extract 1 second of signal around it or transform the signal in order to keep all the meaningful information.
On the right hand side figure is shown average speed for each participant and condition. The global behaviour is that all participant accelerate their head movements. This suggests that, even with a reference before each trial, subject can’t keep the same head speed. The change can be up to \(25^\circ/s\), that is a radical change between two head sweeps.

Fig. 14 Head speed distribution according to participants and speed conditions. The left figure represents mean head speeds during the pursuit and right one represents the mean head speeds during the test presentation. For the pursuit, only sweeps without head direction changes was kept.
perceived speed
What is the impact of the head movement on the perceived speed of the test. As a reminder, participant were asked to judge the direction of the test presented while they were moving their head. The only criteria modified during the task was the speed of the test. And this task was led for 3 head speeds conditions. To analyse the data, for each session, participant and condition, the percentage of test perceived in the direction of the head was computed. Then a psychometric function was extracted using a Probit analysis ([Fin71]. The meaningful information is the PSE at \(50\%\) representing the perceived stationnarity of the test. The figure Fig. 15 shows the results of participant 1 for his first session on each condition. We can abserved firstly that all three PSE are above the \(0^\circ/s\). If someone makes a head movement in front of a fixed sound source, if no effect, were perceived, the perceived speed of the sound source should be \(0^\circ/s\). In the present case, there is a compensation from the participant and the compensation is in the opposite direction to the head. This corresponds to a Filehne illusion as described by [Fil22]. This suggests that participant 1 makes an estimation error that would maybe be on the proprioceptive information (\(\widehat{H}\)) or in the cochlear image motion information (\(\widehat{I}\)) as suggested in vision by [FB98]. Secondly, the figure suggests that the Filehne illusion increased with the head speed according to each condition.
Todo
Comment: Nevertheless, as shown on Fig. 14, participant does not necessary match the theoric head speed conditions espacially during the test presentation. In order to confirm the effect, the Fig. 16 shows the PSE of each participant for each condition. But instead of plotting the theoric head speeds, it’s the actual head speeds that are shown. All participant, whatever the their head speed is suffer the illusion in the same direction (opposite to the head movement). Moreover, the illusion increases as the head speed increases for all participant. An interesting observation would be that the illusion tends to evolve linearly with respect to the head speed. This is difficult to verify as the number of participant is really low. Indeed participant 2 and especially participant 4 doesn’t show a linear illusion but it could explained by the fact that their behaviour were a bit strange compare to the othertodo{really badly explained, need to be rewritten with a better explaination (maybe show their psychometric functions for left and right). As shown on Fig. 15, the psychometric function means that if the participant makes a head movement across a static auditory object, this object would appear to move in the opposite direction of the head movement.

Fig. 15 Psychometric function of the participant 1 for one session. The psychometric function shows the PSE of the test velocity according the test stimulus perceived in the direction of the head. At the \(50~\%\), the stimulus appeared to be stationnary. each color represents one condition (\(20\), \(40\) and \(60~^\circ/s\)).

Fig. 16 Individual differences of PSEs according to the actual speeds on each condition for each participant.
Todo
need to talk a bit about the shift problem and the anova ran on Cass data.
Discussion
Filehne experiment improvements
What could be improve for this experiment? Get more participants in order to ensure the results and especially confirm the results given by participant 2 and 4. Improve the pursuit system by putting the speaker closer and reduce the theoritical size of the source, and maybe use a higher bandwidth in order to get a more ponctual sound source easier to follow. Another idea would be to trained a lot people to excute head movement at specified speed by given them an auditory feedback if they are too slow or fast.
Stimulus properties
According to the results observed above, all subjects suffered the same effect at different strenghs and whatever their actual head speed was. In other words, the audio Filehne effect means if someone moves his head in front of a fixed sound source, this latter will appear to move in the opposite direction of the head movement. Moreover, this effect seems dependent of the head speed. Based on these result, we can assume that audition speed perception, like in vision, will be affected function of several properties. According to [FB98], the retinal image will be affected by several stimulus properties. In the auditory domain, the cochlear image (\(\widehat{I}\)) will be affected by stimulus properties (\(\Omega\)) as given by the (2).
If one of the two estimates evolves in one direction of the other, then the perceived velocity will change [5]. By changing a propertie of a stimulus, the cochlear image estimate (\(\widehat{I}\)) would change (see Table 3 for equivalence). [HCTM07][VPC08] suggested that a visual pattern will appear to move faster at lower intensities. Hence, the Filehne illusion increases as the luminance decreases. Luminance is a visual properties that as an equivalent in audition called the intensity.

Fig. 17 Perceived speed function to the intensity. The blue line represents the visual tendency according of results given by [HCTM07][VPC08]. The purple plain line represents the possible behavior in audition that would be the opposite of vision after informal tests.
| Vision | Audition |
|---|---|
| pursuit (\(\widehat{P}\)) | neck, vestibulus (\(\widehat{H}\)) |
| retinal image motion (\(\widehat{E}\)) | cochlear image motion (\(\widehat{I}\)) |
Filehne vision versus audition estimates.
Todo
check the letters for each estimates and find a way to put a caption under the table.
Following the above results, if the intensity of a sound increases, the resulting speed perception would decrease. Nevertheless, informal tests on the author and colleagues suggested that the perceived speed should increase with respect of the intensity. Unfortunately, pilot data showed on two naive participants reported that participant were unable to do the task. It seems that they were unable to make judgment and can’t linked perceived speed and intensity.
Todo
need to be a bit more precise on the paradigm and why participant were unable to do the task... difficulties to use the speed as the only cue, need to check the exact paradigm.
As explained in the section Auditory localisation, localisation cues are really important and are function of the frequency (Fig. 20). Localisation is usually improved when all localisation cues are available. This means that speed perception could be affected is the spectral components of the source contains only one or two localisation cues in it. [Mil58] showed that MAA is more affected in a specific spectral zone where ITD and ILD aren’t effective enough and where the MAA in front of the listener increases up to \(3^\circ\) (Fig. 18).
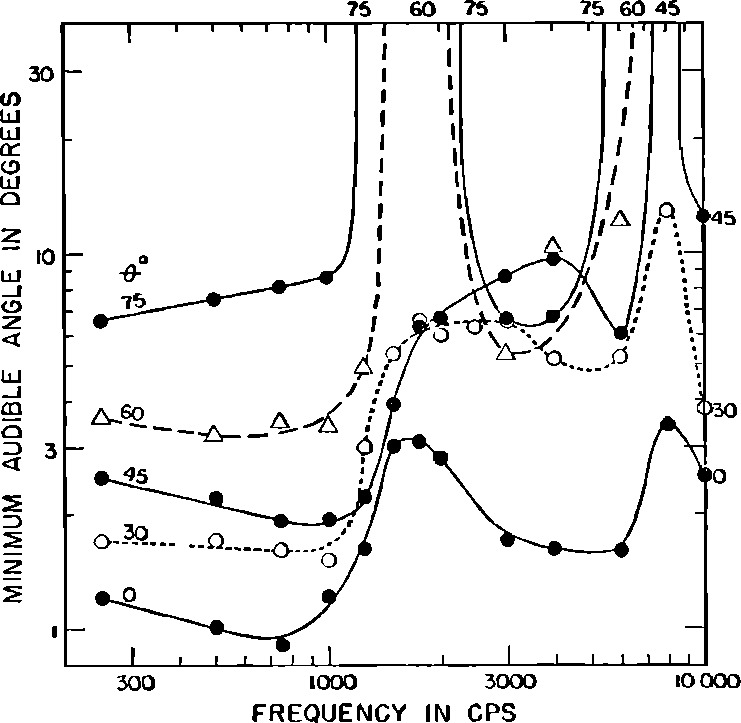
Fig. 18 Frequency dependence of localisation blur in azimuth (expressed here as “Minimum Audible Angle”) using pure tones, as a function of the sound source azimuth position \(\theta\). (After [Mil58]).
This result suggests the possibility that the perceived speed would increase more if a source with a bandwidth from 2 to 3 kHz is presented where human can rely on ITD or ILD.
Correlation between audio and visual Filehne illusion
In order to estimate the object motion during pursuit in vision is to combine estimates of eye velocity and retinal motion and in audition of head velocity and cochlear motion. If in both cases, the combination of the estimates happened in an early stage, auditory and visual Filehne illusion should be independent. Nevertheless, some recent works such as [KPB+03] suggested that ‘retinal’ and ‘extra-retinal’ motion pathways shared a common noise source suggesting that observers do not have a direct access to the retinal motion and that the combination of the estimates should happenned in a later stage of the perceptual system. This have been confirmed by [FCSS09] who used a 2IFC task in which observers had to indicate which interval contained the faster background motion, while pursuing a target that moved across the background.
Hence, it would be interesting to lead in parallel both auditory and visual Filehne illusion experiments and observe if a correlation between both data sets exists (Fig. 19). If so, it will suggest that both auditory and visual motion pathways are shared in a later stage of the perceptual system and confirm results given above.

Fig. 19 Possible correlation between the visual and auditory Filehne illusion.

| [1] | By ponctual, the source will be broadcast by the closest speaker and all over will be set at 0 dB. |
| [2] | The participant, if necessary could ask for a training for following sessions because sessions occurs overs two weeks. |
| [3] | For a better understanding of this type of filter, the reader can refer to [Sch11]. |
| [4] | Or at least in a insifignant way, with small reflections due to the torso. |
| [5] | In this particular case, the illusion could increase, decrease or be invert (as suggested by [FB98], that’s why velocity is used instead of speed. |